
Industry: Energy / Power Generation
Service: Data Engineering
Timeline: 6 Weeks
Jira Analytics Platform for Energy Fleet Operations
Team: Tempered AI, in partnership with Computomic

March 24, 2026

Executive Summary
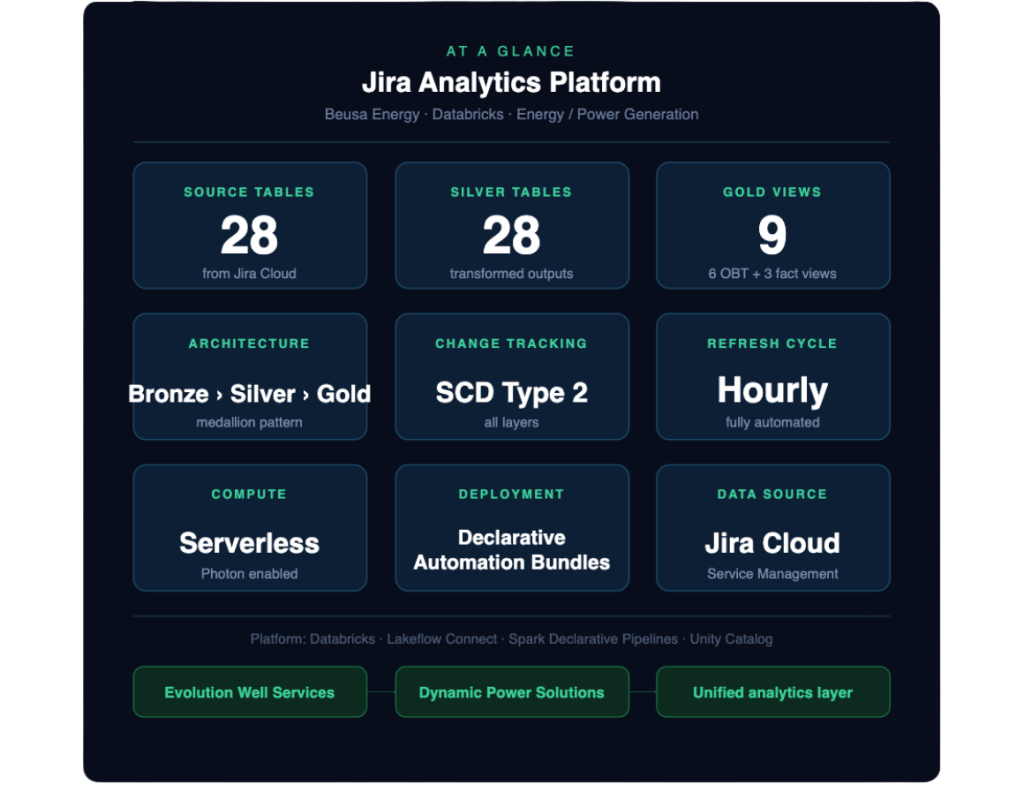
Beusa Energy manages field service and equipment operations across two business divisions. Evolution Well Services and Dynamic Power Solutions, both using Jira Service Management to track issues, maintenance requests, and support workflows. The data was there, but Jira's underlying structure made it impossible to analyze at scale. Tempered AI built a fully automated Databricks pipeline that ingests, transforms, and unifies Jira data from both divisions into a single analytics layer, refreshed hourly and ready for dashboards and operational reporting.
About the Client
Beusa Energy operates across two distinct divisions: Evolution Well Services, focused on field equipment and well servicing, and Dynamic Power Solutions, which handles power generation and fleet support. Both divisions rely on Jira Service Management to manage day-to-day operational workflows, but each tracks different assets, uses different custom fields, and runs on different SLA configurations, making cross-division analysis nearly impossible without significant data transformation.
The Challenge
Beusa Energy manages field service and equipment operations across two divisions. Evolution Well Services and Dynamic Power Solutions, both using Jira Service Management to track issues, maintenance requests, and support workflows. That data was valuable, but four compounding factors made it analytically unusable without significant transformation.
Jira wasn't built for analytics
Jira stores custom field values in a normalized key-value format, one row per field per issue. A single issue with 20 custom fields produces 20 separate rows, each wrapped in nested JSON with inconsistent structures. SLA timers, asset references, equipment types, and case categories all live inside complex data envelopes that must be parsed individually before the data becomes usable.
Two divisions, two schemas, one business
Evolution Well Services and Dynamic Power Solutions track fundamentally different aspects of the business, different custom fields, different asset identification methods, different SLA configurations. Leadership needed a single unified view across both divisions, which didn't exist.
The Solution
The team designed and implemented a three-layer medallion architecture. Bronze, Silver, and Gold, that ingests 28 Jira source tables, transforms them through multiple processing stages, and delivers 9 business-ready analytical views. The system runs on serverless compute, refreshes hourly, and is deployed via Declarative Automation Bundles with full CI/CD integration.
Bronze: Automated Ingestion via Lakeflow Connect
All 28 Jira source tables are pulled directly from Jira Cloud using Lakeflow Connect, no custom extraction code. Tables include issues, comments, field values, projects, users, worklogs, and more. Full change history is preserved using SCD Type 2 tracking, and downstream layers consume only new changes via Change Data Feed.
Silver — Declarative Pipeline (3 stages)
Stage 1 streams CDC changes from Bronze.
Stage 2 runs a config-driven dynamic pivot, instead of hardcoding logic for each field, the pipeline reads from a configuration table and builds the pivot at runtime, producing one wide row per issue. Adding a new custom field requires only a single insert into the config table.
Stage 3 handles enrichment and JSON extraction: asset identities are resolved per division, and SLA timers, equipment details, customer names, and fuel types are extracted into clean, queryable columns.
Gold — SQL Views
9 SQL views serve as the final interface for dashboards and reporting: 6 wide denormalized One Big Table views for direct consumption, and 3 metric-oriented fact views covering issue resolution, comment timelines, and lifecycle funnel analysis. Because they are views, they always reflect the latest Silver data with no additional storage cost.
Technical Highlights
The pipeline's most significant design decision was separating the pivot mechanism from the enrichment logic. By making the pivot config-driven rather than hardcoded, the system is self-maintaining, new Jira fields appear in analytics automatically without engineering work. The Silver layer runs as a Spark Declarative Pipeline on serverless compute with Photon enabled. Both pipelines are packaged as Declarative Automation Bundles with dev/prod environment separation and automated hourly scheduling.
The Result
Cross-division analytics are now available in a single unified platform for the first time
Issue volume, status, and resolution trends are trackable across both Evolution Well Services and Dynamic Power Solutions
SLA compliance and breach rates are visible across all service tiers in real time
Equipment and fleet-level issue patterns can be analyzed by asset, model, and fuel type
Full issue lifecycle is traceable from creation to resolution, including comment activity and response timelines
New Jira custom fields appear in analytics automatically — no engineering work required
Hourly automated refresh with zero manual data preparation
Why It Works
The challenge wasn't connecting Jira to a lakehouse, it was making the data inside Jira analytically trustworthy. Jira's data model was designed for application flexibility, not analytical consumption. By building a pipeline that handles the structural complexity, the key-value field storage, the nested JSON, the divergent division schemas, the solution gives Beusa a foundation for real operational insight that grows with the business.
Interested in unified analytics across your operational tools?
Whether you're managing field operations, service workflows, or equipment fleets, we can build the data layer that makes your existing tools analytically powerful.

